We’re just into the fourth quarter of 2022, and it’s been a doozy for ecommerce. As we finally emerge from the pandemic, the landscape has changed. From impediments like supply chain issues to national, and sometimes international shortages, all the way to reduced consumer spending across the board, the retail industry has been through a lot.
Thankfully, the worst is now in the rearview mirror. Picking up right from where we left off, here’s our bible of 2022’s cross-channel ecommerce statistics.
Industry Outlook for Q4 2022
Last year, research by Insider Intelligence found that nonstore cross-channel ecommerce sales would top out at $516.11 billion, with annual growth exceeding 17%. For 2022, the same think tank is predicting that these omnichannel sales will drive up to 46% of all ecommerce sales by 2023, representing a healthy increase of more than 40% over the past three years.
All said and done, nonstore retailers selling across multiple verticals are predicted to cap the market with at least $680 billion in total sales for 2022.
Returns Are Increasing
Retail return rates climbed by 6% year over year, according to research by CNBC, jumping from 10.6% in 2021 to 16.6% this year. All said and done, retailers are leaving more than $761 billion on the table that will ultimately find its way back to warehouses, store shelves and consignment wholesale auctions.
Last year, the average online product return rate also increased, according to the NRF, increasing from 18.1% in 2020 to 20.8% in 2021. This year, holiday returns are projected to surpass 17.8%, accounting for $158 billion in goods that will be sent back to online retailers in 2022. Likewise, overall internet sales are projected to increase by more than 14%, peaking at almost $900 billion.
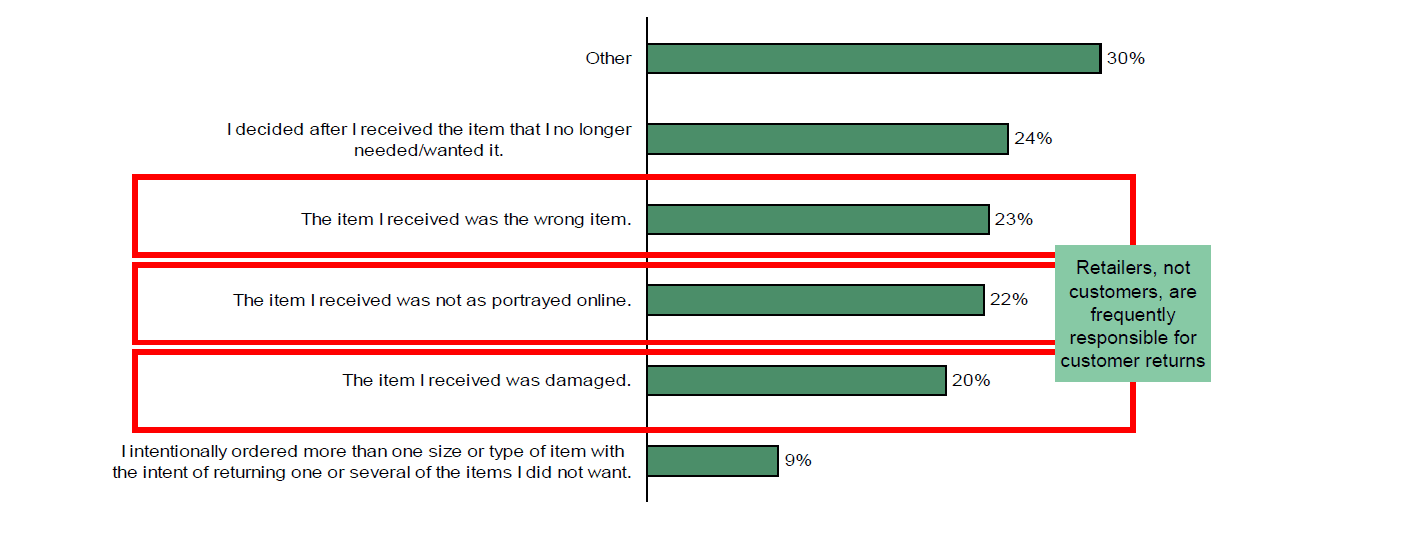
Unknown to most retailers is that many times the return isn’t the consumer’s fault. Recent (enough) data on ecommerce returns finds that 20% of returns are due to a faulty product being received; 23% are due to the product looking significantly different than advertised online; and another 20% of returns are due to the wrong product having been shipped in the first place.
Given this information, having a return policy in place that’s consumer centric, forward-facing, transparent and simple is critical to the long term success of any e-tailer.
A bad return policy can kill sales that you could be adding to your bottom line. Consider these simple facts for 2022 before making any adjustments:
➡️ 79% of Consumers Want Free Return Shipping
➡️ 80% of Consumers Desire Hassle-Free Returns
➡️ 55% of Consumers Don’t Want Restocking Fees
➡️ 92% of Consumers Will Buy Something Again if Returns Are Easy
➡️ 82% of Consumers Won’t Buy Something Again if Returns Are Not Easy
➡️ 81% of Consumers Want an Easy Way to Return a Product
Bracketing is Becoming a Mainstay
What is ecommerce bracketing and why do you need to know about it as part of our ecommerce cross-channel statistics for 2022? Because it’s popular across nearly every sales channel that exists in today’s online world.
Ecommerce bracketing is where a consumer orders multiple sizes (and or) colors of the same piece of apparel. After they’ve had a chance to try on the different items, they keep what they want and send the ones they don’t back, forcing the retailer to absorb the cost difference.
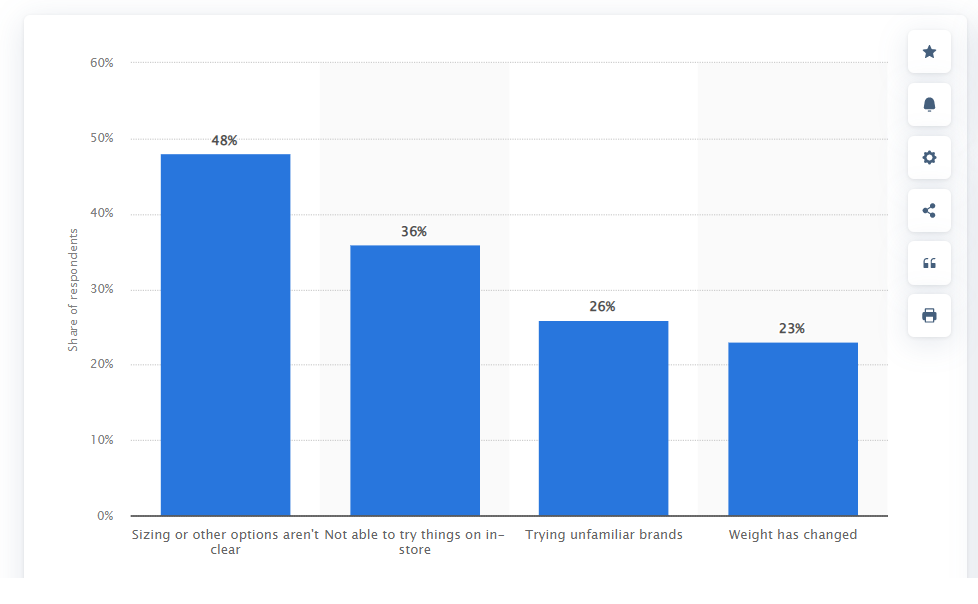
Bracketing is quickly becoming a common practice for consumers who purchase apparel online. A quick look at some statistics on ecommerce bracketing find that:
➡️ 36% of consumers in the U.S. bracket a purchase simply because they’re unable to try on the clothing.
➡️ 58% of U.S. consumers order multiple items in different sizes and colors with the intention of returning the ones that don’t fit.
➡️ 40% of consumers occasionally bracket.
➡️ During the holidays, bracketing occurs in almost 58% of apparel purchases.
➡️ 15% of apparel returns annually are directly related to bracketing.
➡️ More than $30 billion in bracketed goods will be returned this holiday season.
➡️ As much as 50% of returned bracketed goods are not resellable to consumers.
➡️ Adding sizing apps can reduce bracketing by up to 24%.
Without a doubt, any retailer that’s selling apparel online in 2022 is going to have to deal with and properly manage bracketing in some way, shape or form. The good news is that customers who do bracket tend to make higher value purchases, become repeat customers and often turn into avid and vocal brand ambassadors in the long run.
Shipping Options Are Plentiful
There are more shipping options today for e-tailers than ever before, and consumers love the convenience of front door delivery. As companies like Amazon and Walmart expand their interior logistics infrastructures, faster delivery service is becoming the new normal.
The supply chain is getting back on track this year, which means that products, for the most part, are being kept well in supply. The USPS’ recent rate hike has increased costs marginally for multichannel retailers, with this year’s holiday surcharges from USPS, UPS and FedEx also temporarily increasing outbound and return costs all-around.
With ecommerce headed towards new global records — experts are predicting a $5 trillion dollar year — these current statistics on ecommerce shipping for cross-channel retailers will keep you up-to-date.
2022 Statistics on Ecommerce Shipping
➡️ 40% of consumers have at least one package per week shipped to them from an Amazon order.
➡️ Offering free shipping encourages more than 80% of consumers to shop at your store.
➡️ More than half of all multichannel consumers want a same-day or two-day shipping option.
➡️ 80% of shoppers want to get a post-purchase message on their order status.
➡️ More than 40% of shoppers will abandon a shopping cart due to high shipping costs.
➡️ 70% of retailers are working to improve communication with consumers post-purchase.
➡️ More than 20% of consumers would increase their average order value if a free shipping threshold was offered.
➡️ 50% of multichannel sellers find the logistics behind shipping to be a challenge.
➡️ 75% of multichannel sellers still don’t know how to get the best shipping rate for their business.
➡️ Multichannel big box stores like Target and Walmart have already integrated next-day shipping options, but for 70% of online sellers, offering next day delivery isn’t realistic.
If you are looking for more information on this, have a read of: Your Guide to Ecommerce Shipping in 2021. It’s packed full of helpful information that you can use to improve your shipping process across the board.
Shipping Insurance is Becoming a Must-Have
While shipping insurance is nothing new, more retailers are adding it to the spectrum to protect shipments to and from their destination without incurring losses along the way.
In July of this year, Shopify, the leader in multichannel ecommerce platforms, announced that it would be including shipping insurance (up to $200 per item) on all new orders shipped (when the shipping labels are generated by the platform).
The USPS, UPS and FedEx all have valuable shipping insurance add-ons that cross-channel sellers should consider. There are also a variety of third-party shipping insurance options that you can look into as well.
Cross channel sellers should be aware of these porch piracy and loss statistics for 2022 to better understand why shipping insurance is a must-have amenity for high-value fulfillables.
➡️ More than $4 billion in losses from stolen packages between 2019 – 2021.
➡️ Last year, more than 200 million packages were stolen.
➡️ Average cost of a stolen package is $160.
➡️ Fewer than 55% of consumers get a refund for a stolen package.
➡️ More than 60% of Americans will experience package theft this year.
➡️ Half of Americans have installed cameras to protect against package theft.
➡️ 3% of Americans have admitted to stealing a package.
As you can see, adding shipping insurance to your high-value outbound parcels is good thinking. Fortunately, a variety of options exist today that you can consider using to add protection to your multichannel orders in 2022.
Prices Are Going Up
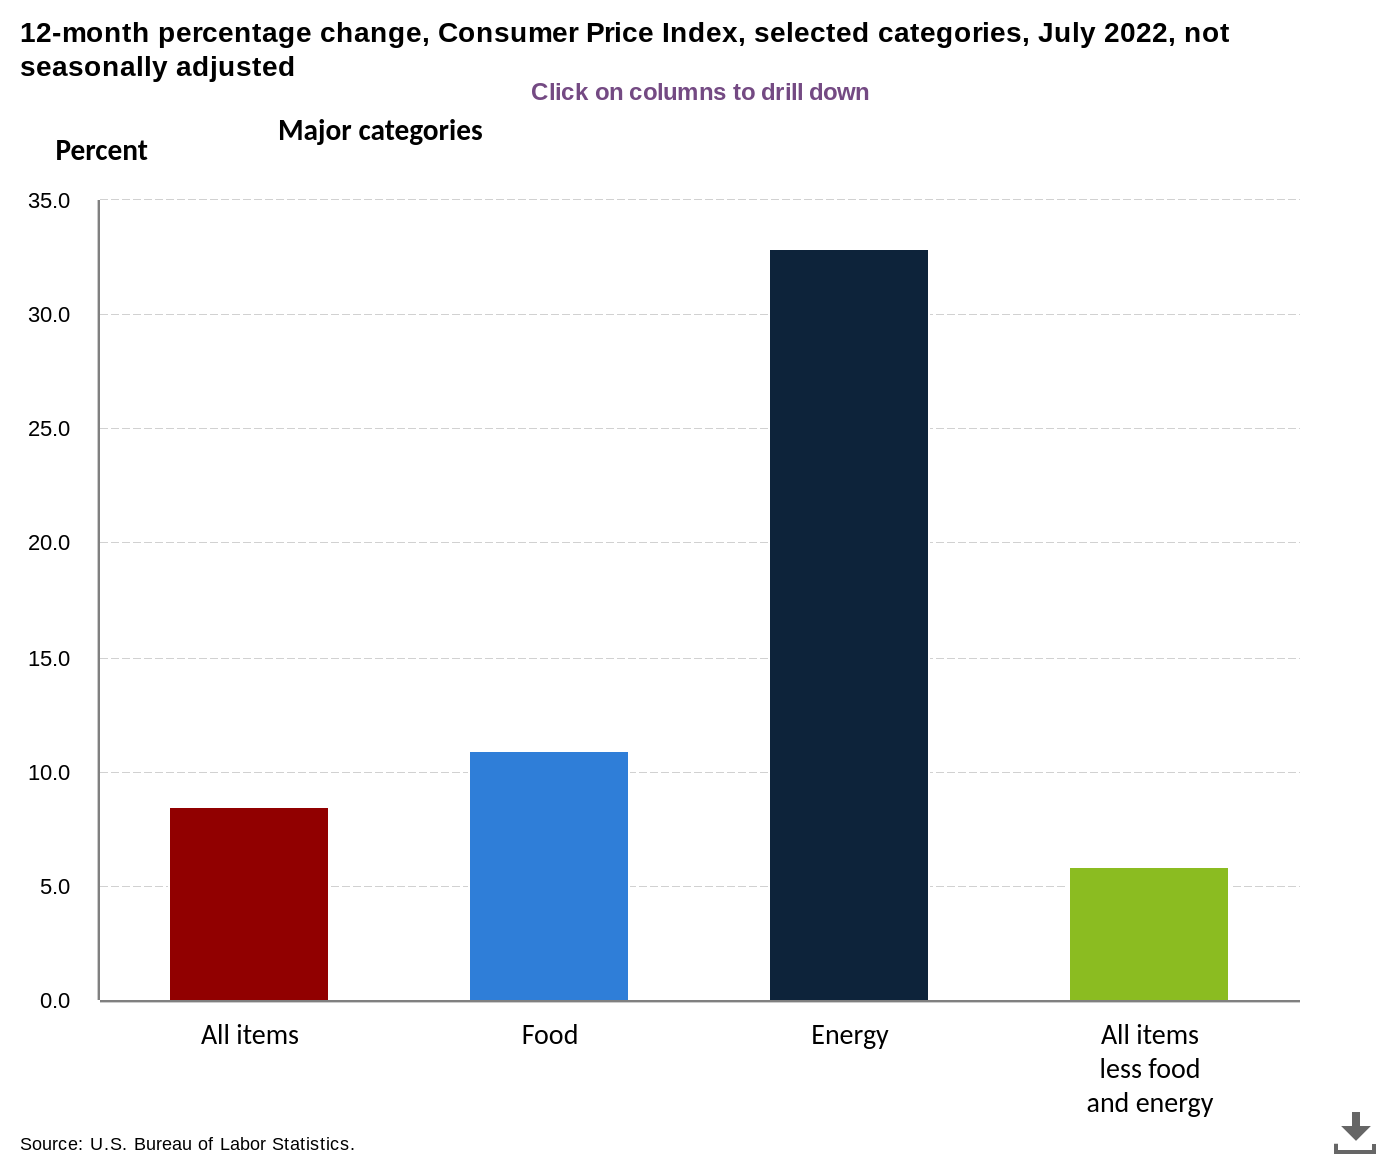
Inflation has been a pain point for Americans and the rest of the world post pandemic. According to the U.S. Bureau of Labor Statistics, inflation rose nearly 10% over the past 23 months, and you can be certain that these increases in cost and decreases in spending power are directly passed onto the consumer.
According to research by Jungle Scout, inflation has had a tremendous impact on the habits of consumers, in particular those who would normally buy something online.
➡️ 77% of consumers say they’ve adjusted their spending due to inflation.
➡️ 72% are avoiding impulse purchases and are spending less overall.
➡️ 59% are looking for less expensive, knockoff brands.
➡️ 52% are only shopping for discounts or flash sale products.
➡️ 51% are only buying generic products altogether.
➡️ 42% are reducing dependency on certain products and are not buying them.
➡️ 38% report decreased spending overall.
Contributing to inflation are worldwide shortages of goods, including chips for computers and vehicles, raw materials for cosmetics and textiles, coupled with the main ports of entry being overwhelmed by an abundance of inbound shipments and lack of adequate human resources to unload these shipments. Combined, these elements have seen computer prices increase by 13% or more, and cosmetics and textiles increase in cost by 75% or more over the past 24 months.
Keeping an eye on your competitors and ensuring that your prices are within the spectrum of competitiveness, combined with offering low-cost or free shipping and easy returns can help you stay a step ahead of the game.
The Cross Channel Spectrum
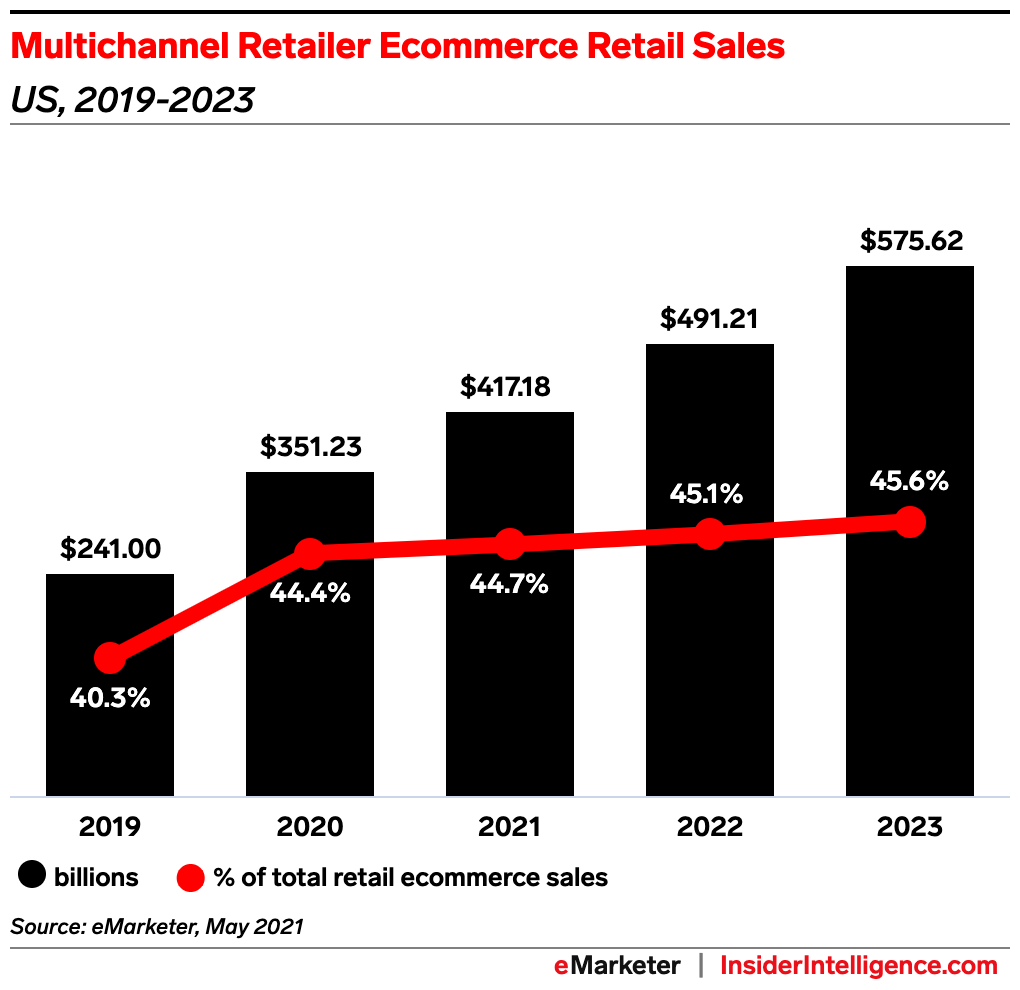
Looking under the lens at revenue figures from 2020 and beyond, the outlook for multichannel annual sales is healthy. For 2021, cross-channel ecommerce generated more than $350 billion in the U.S. For 2022, the number (tops off as of August) at a ripe $417 billion. By the end of this year, multichannel sellers will have generated an astounding $491 billion in annual sales. By 2023, this number could very well exceed $576 billion.
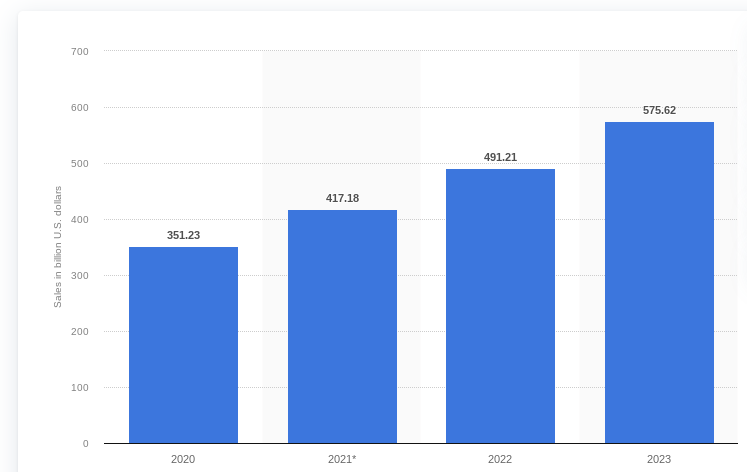
Multichannel e-commerce retail sales in the United States from 2020 to 2023 (in billion U.S. dollars)
MCommerce is the Future
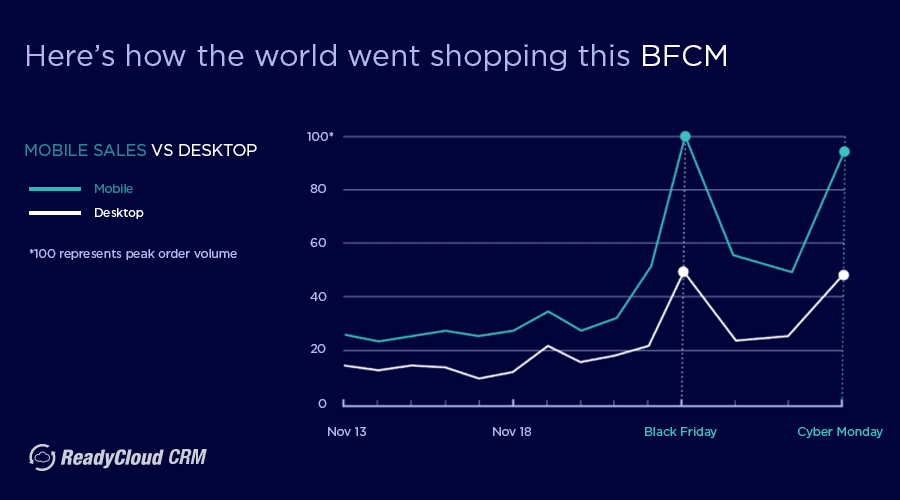
Mcommerce, or mobile commerce, is quickly on the path to become the future revenue leader for e-retail. In 2022, nearly 55% of all traffic that comes to an online store will originate from a mobile device. What’s more, 35% of all cross-channel ecommerce transactions will have come from mobile this year.
The Black Friday / Cyber Monday sales records from 2021 are testament to the increase in multichannel market share that mobile commerce is capturing:
Here are some more juicy cross-channel mobile commerce and traffic statistics for you to feast your brain on:
➡️ 53% of global online traffic comes from mobile devices.
➡️ 57% U.S. online traffic comes from mobile devices.
➡️ 200% increase in interactions when mobile devices are used.
➡️ 80% of users will complete sales when sites offer Q/A for mobile users.
➡️ 72% of all digital ad spending will go to mobile this year.
➡️ 68% of companies are now using mobile marketing as a strategy.
➡️ 31% increase in Black Friday sales from mobile year-over-year.
➡️ 33% increase in mobile payments by 2022 for an estimated $3.38b+.
➡️ 32% increase in digital wallet usage from mobile by 2022.
➡️ 71% of mobile purchases come from email influence.
➡️ 85% of users begin a sale on one device and complete it on another.
➡️ 52% of mobile shoppers will shop elsewhere after a bad experience.
➡️ 57% of mobile shoppers will abandon the cart if the load time is 3 seconds or greater.
➡️ 82% of shoppers browse ecommerce stores from mobile while in-store.
➡️ 62% of shoppers compare prices from mobile devices before buying.
➡️ $1 trillion in spending offline was influenced by mobile in 2018.
➡️ Mobile commerce sales topped $626 billion in 2018.
➡️ People spend more than 140 minutes per day browsing their smartphone.
Mcommerce is predicted to realize a gain of at least 25% by 2024, accounting for more than $480 billion of the total ecommerce haul in the U.S. For certain, Mcommerce plays a large role in the overall haul for cross-channel sellers. If you’re looking for even more information, take a gander at our guide: 50 Facts About Mobile Commerce for 2022.

SMS Post Purchase Messages
More retailers are adding SMS/text message updates and cross promotions to the mix. These serve to not only provide desirable order status updates to customers, but also to increase the average order value by providing behavior and seasonally based upsells and cross promotions to consumers.
These convenient post-purchase messages keep users informed and have a staggering 97% open rate. Here are some other facts you’ll want to know about MCommerce:
➡️ 64% of consumers develop a favorable opinion of companies that engage with them through SMS for customer service.
➡️ SMS coupons are redeemed 10 times more than on other channels. (This is your sign to start disseminating coupons through SMS!)
➡️ 67 million Americans redeem mobile coupons through their smartphones.
➡️ The top four most valuable text messages received from businesses are: appointment reminders (68%); shipment updates (30%); booking updates (20%); promotions and discounts on products/services (14%).
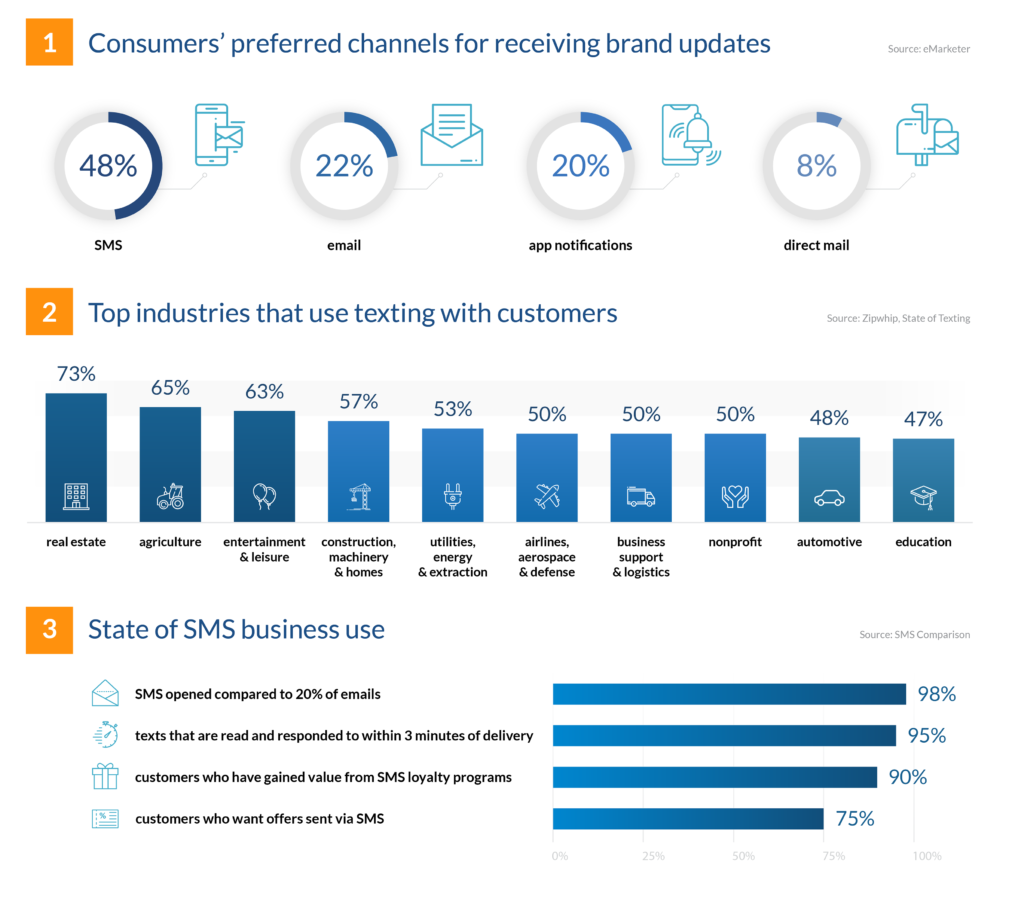
More omnichannel sellers are implementing text message marketing for growth because of the low cost to yield and the high conversion rate.
➡️ Text marketing is incredibly effective, with SMS open rates as high as 98%.
➡️ SMS marketing click-through rates for ecommerce brands can be as high as 36%.
➡️ SMS messaging is one of the fastest ways to reach consumers directly; 60% of consumers say they read a text within 5 minutes of receiving it.
➡️ 33% of SMS recipients react to CTAs in SMS marketing messages, and 47% of those end up making a purchase.
➡️ 98% of Sent Text Messages are Read.
➡️ SMS messages have a 209% higher response rate than phone, email or Facebook.
As you can see, there’s a lot to like about using post-purchase SMS and email messages to grow a brand and maintain a customer service model across multiple verticals. We’ve got even more tips in this arena for you in our related guide: How to Use Email and SMS Automation to Boost Ecommerce Sales.
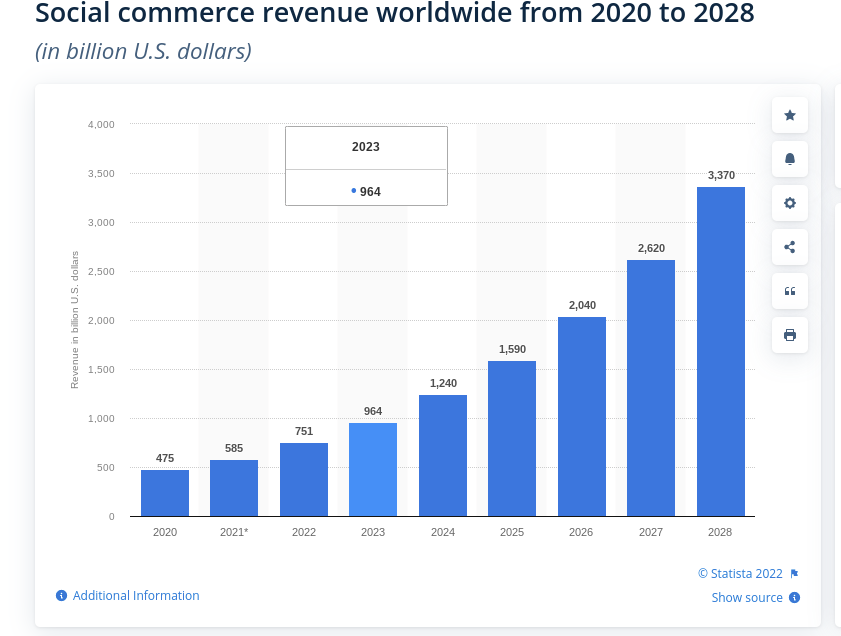
Social Commerce is a Juggernaut
Social commerce has become tethered at the hip for ecommerce, for all extents and purposes, helping to drive more than 34% growth rate over the past five years. Testament to this is the influencer industry, which is predicted to haul in more than $10 billion in advertising payouts this year alone via popular channels like Instagram, TikTok, Facebook, Twitter, Pinterest and others.
These social commerce statistics demonstrate just how vital a channel its become for e-retail, and how far reaching the appeal influencers truly is:
➡️ 25% of consumers look to social networks for advice when they go clothing shopping.
➡️ 90% of people who follow a brand via social media will try to reach out to said brand.
➡️ 50% of customers say that customer service on social media has made it easier to ask questions and have their issues resolved online.
➡️ In 2017, social networks saw $41 billion in advertising revenue – Facebook alone claimed $10.14 billion of this.
➡️ The average customer spends $1.8K on shopping annually.
➡️ Instagram offers the highest average order value on the web, with standard customers spending about $65 per purchase on items through the app.
➡️ Favorable product reviews on social media can bump a product’s price by about 9.5%, and more than 71% of consumers change their perception of a brand after they see a positive response to social media reviews.
➡️ 10% of social shoppers are between 25-34 years old.
➡️ Facebook offers a 6.21% market share and a 0.77% conversion rate.
➡️ The top 500 online retailers earned $6.5 billion from social commerce in 2017.
➡️ Smartwatches, video doorbells, facial masks, and phone cases are some of the top-selling products on social media.
➡️ 67% of Millennials would rather shop online than go to a physical store.
➡️ For 2022, social commerce is expected to surpass more than $25 billion in total sales.
➡️ More than 40% of retailers polled in a recent study say they’ll be investing heavily in social commerce in 2022 and beyond.
➡️ Positive interactions on social media can increase conversions by 77% or more.
➡️ 87% of customers say social media has helped them make a purchasing decision in the past.
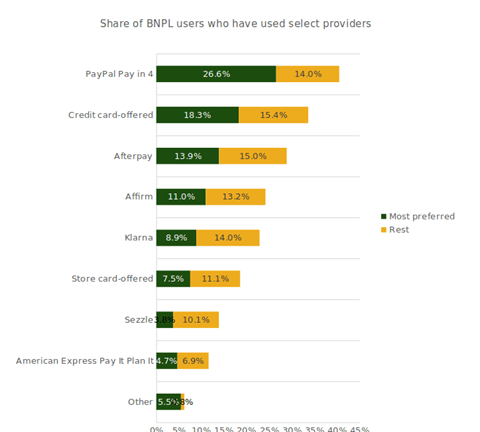
Buy Now Pay Later (BPNL)
Commonly referred to by its acronym, BPNL, Buy Now Pay Later has become a fascination in ecommerce and is an immensely popular revenue-generating tool for omnichannel sellers. Retailers tether into a third-party service to drive sales that otherwise probably wouldn’t happen unless consumers were offered a payment plan on the products being sold.
A few multichannel statistics to glean about BPNL in this space include:
➡️ Nearly 10% of consumers are using a BPNL service.
➡️ BPNL services saw an increase in usage of more than 37% this past year.
➡️ More than half of people in a recent survey stated they’d use BPNL in the future.
➡️ PayPal has the most popular BPNL service; it boasts a 43% usership rate.
➡️ Electronics retailers make up for more than 45% of BPNL usage.
➡️ 61% of BPNL users would rather use a BNPL service offered directly from the retailer they’re buying from than going through a third-party.
Omnichannel Shopping Statistics for 2022
Last but not least, here’s our newest batch of ecommerce omnichannel statistics. We’ve dug around to find what we feel are the most relevant statistics related to cross-channel selling. Without further ado, here they are:
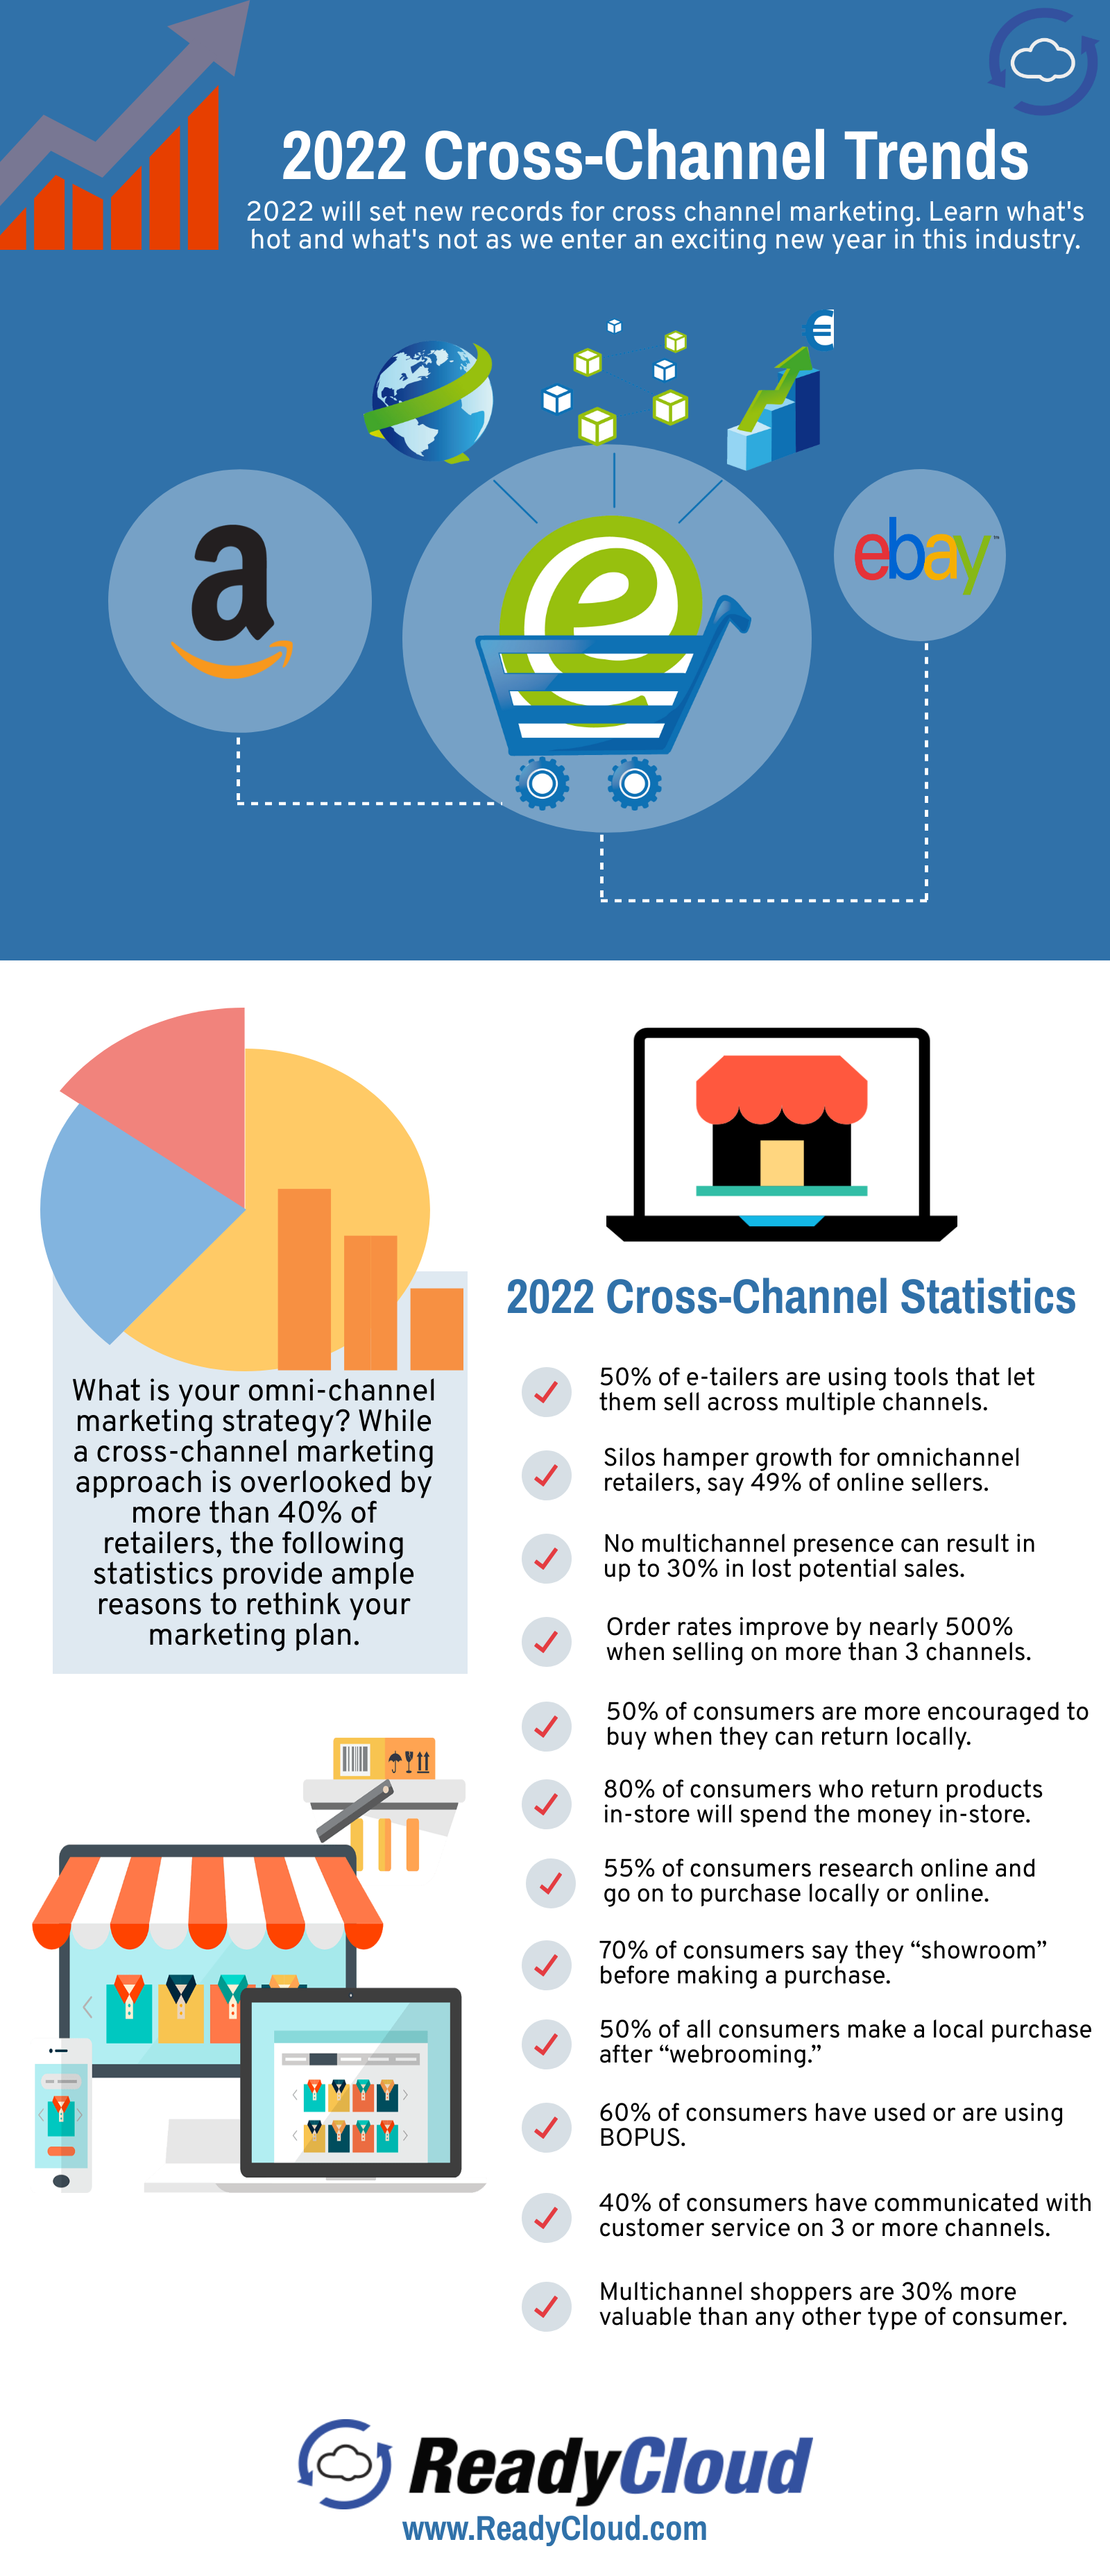
➡️ More than 50% of e-tailers are using tools that let them sell across multiple channels.
➡️ Organizational silos hamper growth for omnichannel retailers, say 49% of online sellers.
➡️ Integration of data for click and mortar stores proves difficult for 47% of e-tailers.
➡️ Lack of a multichannel presence can result in up to 30% in lost potential sales.
➡️ Order rates can improve by nearly 500% when selling across more than three channels.
➡️ Nearly 50% of consumers are more encouraged to buy when they can return locally.
➡️ Almost 80% of consumers who return products in-store will spend the money from the return in-store.
➡️ More than 55% of consumers research online and go on to purchase locally or online.
➡️ More than 70% of consumers say they “showroom” before making a purchase.
➡️ More than 50% of all consumers make a local purchase after “webrooming.”
➡️ More than 60% of consumers have used or are using BOPUS.
➡️ Almost 40% of consumers have communicated with customer service on three or more different channels.
➡️ More than 70% of consumers say they prefer to shop online versus locally post pandemic.
➡️Multichannel marketing that includes SMS messages to consumers are 47% more likely to convert.
➡️The frequency of purchases on multichannel, as compared to single channels, is more than 250%.
➡️Multichannel shoppers are 30% more valuable than any other type of consumer.
Wrapping it All up
It’s an exciting time for the ecommerce industry as a whole. As consumer spending habits improve and the issues of the previous two years begin to fade, things are picking up pace again and are back on track for what’s shaping up to be yet another record-setting year. Scroll down to see a new infographic we’ve created that outlines the most pertinent cross-channel ecommerce statistics for 2022. Feel free to borrow and share it as you like!
If you want even more tips, take a read of our related guide: 60 Statistics on Ecommerce for 2022 That You Need to Know.